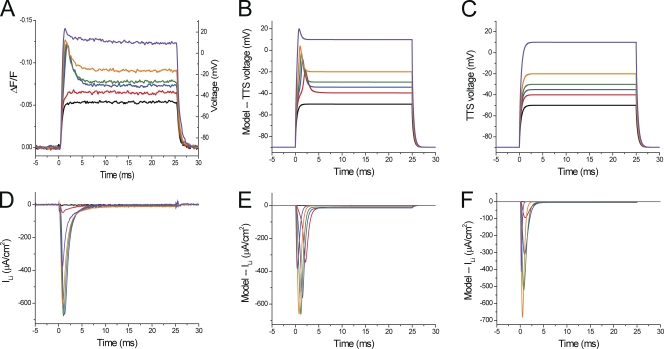
Figure 10.
Comparison between experimental data and radial cable model predictions. (A) Di-8-ANEPPS transients recorded in response to 0-, 50-, 55-, 60-, 70-, and 100-mV depolarizing pulses (black, red, blue, green, orange, and purple traces, respectively). The deconvolution of ΔF/F (left vertical axis) into membrane potential (right vertical axis) was done according to the regression formula: (in mV). (B) Model predictions of the TTS membrane potential assuming that the Na channel permeability density is 5.64 × 10⁻⁴ cm/s at the TTS membranes (-TTS) and 3.76 × 10⁻⁴ cm/s at the surface membrane (PNa-S). The access resistance for the TTS (Rs) was 10 Ωcm2. Other model parameters are listed in Table A1. (C) Model predictions of the TTS membrane potentials assuming that ILi is only generated at in the surface membrane (-TTS = 0 and -S = 11.1 × 10⁻⁴). (D) Experimental ionic currents corresponding to the optical records in A. (E and F) The predicted ionic currents associated with the simulated traces in B and C, respectively. The same color code was used in A–F. Fiber parameters: radius, 30 µm; length, 572 µm; capacitance, 4.9 µF/cm2.

