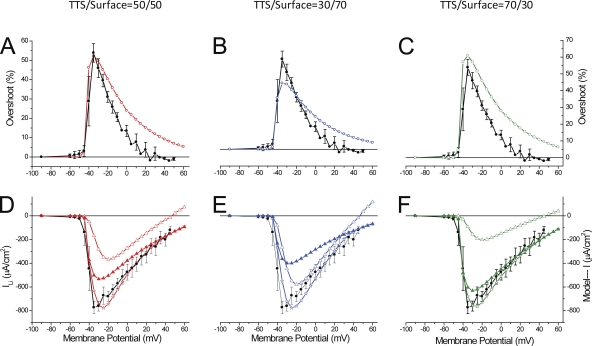
Figure 13.
Model predictions of overshoot and currents for various PNa distributions in the surface and TTS membranes. (A–C) Voltage-dependent overshoots calculated (see Fig. 11 A) using the following -TTS/-S ratios: 1 (or 50:50) in A; 0.429 (or 30:70) in B; and 2.333 (or 70:30) in C. The total values of were 12 × 10−4 cm/s, 13.5 × 10⁻⁴, and 11 × 10−4 for the calculations of the overshoot in A, B, and C, respectively. In every panel, the filled black symbols are the average values shown in Fig. 9 A; the superimposed open symbols were obtained with 50:50 (A, red), 70:30 (B, blue), and 30:70 (C, green) S/PNa-TTS, respectively. (D–F) Average peak I-V plots of ILi as shown Fig. 9 B (black symbols) are superimposed with model predictions for 50:50 (A, red symbols), 30:70 (B, blue symbols), and 70:30 (C, green symbols) -TTS/-S ratios, respectively. In every panel, open stars represent the total current, filled triangles represent the TTS current component, and open triangles represent the surface membrane current component. The fiber radius used in model simulations was the average for all the experiments (25 µm), and Rs was 20 Ωcm2. The rest of the model’s parameters are listed in Tables I and II.

