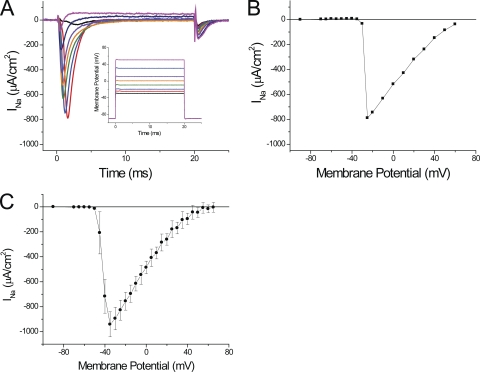
Figure 2.
Sodium currents recorded in 1/2Na external solution. (A) Currents obtained after the subtraction of linear components from records obtained in response to step depolarizations to −30, −25, −20, −10, 0, 10, 30, and 50 mV (black, red, blue, green, orange, purple, dark blue, and magenta, respectively). The membrane potentials recorded by the voltage electrode are shown in the inset (same color code). Fiber parameters: radius, 28 µm; length, 410 µm; capacitance, 5 µF/cm2. (B) Voltage dependence of the peak sodium currents (INa) for the same fiber as in A. (C) Average peak INa plotted as a function of the membrane potential. Data were obtained from eight fibers in 1/2Na external solutions. In B and C, the symbols are connected with straight lines.

