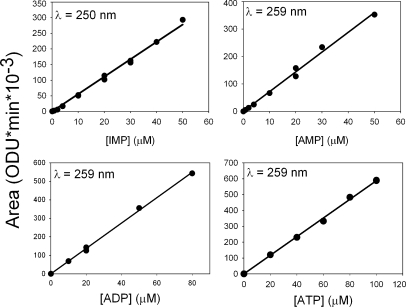
Figure 2.
Calibration curves of ATP, ADP, AMP, and IMP. The recorded peak area values (in ODUs × minutes × 10−3) at 259 nm for adenine nucleotides and at 250 nm for IMP are plotted as a function of nucleotide concentrations dissolved in solution A. The range of concentrations covered matched those in the RBC samples. Data are from 13 experiments, like that illustrated in Fig. 1, with different nucleotide additions.

