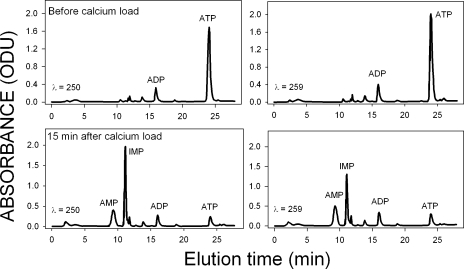
Figure 3.
Nucleotide chromatograms at 250 nm and 259 nm from RBC samples, before and 15 min after a sustained PMCA-saturating calcium load. Left, 250 nm; right, 259 nm; top, before calcium load; bottom, 15 min after calcium load. RBCs were incubated in the absence of metabolic substrates. Results are representative of three identical experiments with blood from two donors.

