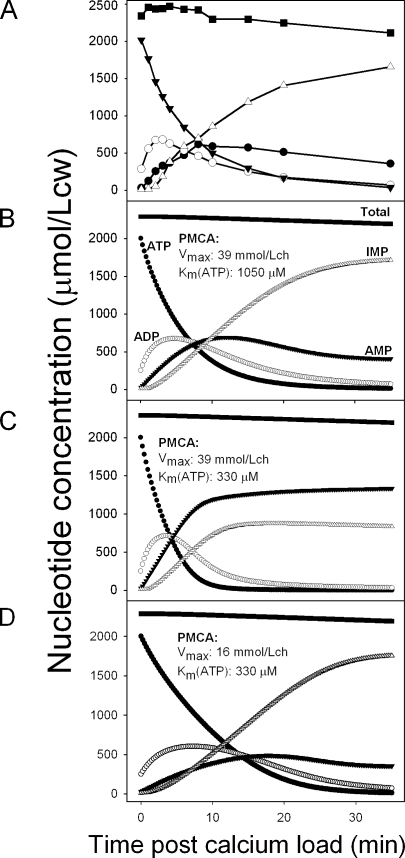
Figure 5.
Comparison between patterns of calcium-induced nucleotide changes observed experimentally and predicted by the three-enzyme-model. (A) The experimentally observed pattern shown in Fig. 4 is reproduced to aid direct visual comparisons. (B–D) Selected model-derived patterns using the Ca2+ ATPase Vmax and Km(ATP) parameter values shown in the figures and the default values reported in the Appendix for all the other parameters of the system. The rate of IMP breakdown to hypoxanthine, which is responsible for the decline in total nucleotide concentration, was set at 0.2 mmol/Lch in all simulations. (B) Best-fit parameter values for pattern reproduction. (C) Pattern rendered when using experimentally determined Km(ATP) values at high Vmax. (D) Pattern rendered when using Vmax–Km(ATP) values within measured ranges.

