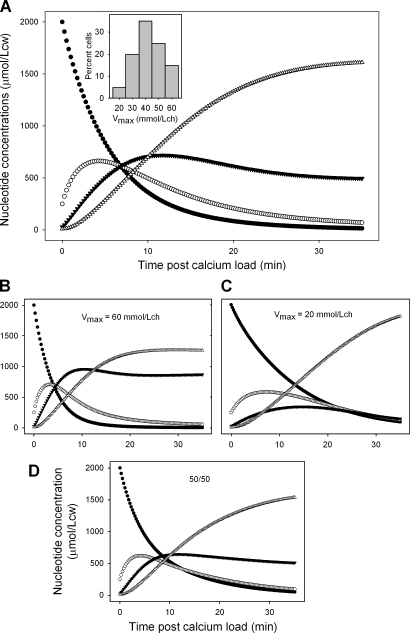
Figure 6.
Predicted patterns of mean nucleotide changes in RBCs with distributed values of the Ca2+ ATPase VPmax, at Km(ATP) = 1.05 mM. (A) Mean pattern obtained with the VPmax distribution shown in the inset. (B) Pattern corresponding to a VPmax of 60 mmol/Lch. (C) Pattern corresponding to a VPmax of 20 mmol/Lch. (D) Mean pattern resulting from an equal mix (50/50) of the patterns in B and C. The mean VPmax in both A and D is 40 mmol/Lch. Closed circles, ATP; open circles, ADP; closed triangles, AMP; open triangles, IMP.

