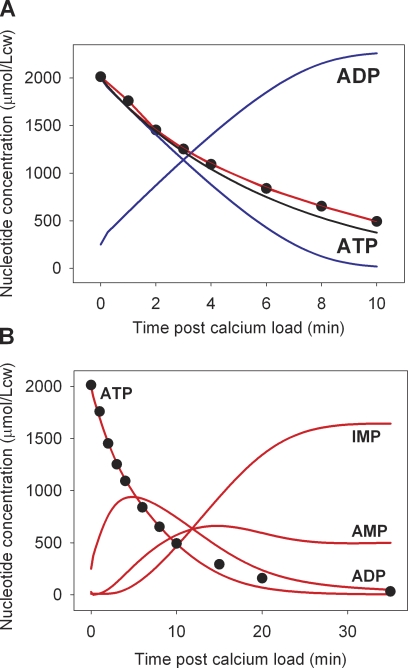
Figure 8.
Model tests of the membrane pool interpretation of the data using ATPase parameters within measured ranges. Note the different timescales of the x axes in A and B. Red curves report the result of model simulations run with the introduction of delay factors of the form KAK(t) = KAK × (1 − exp[−k × t]) and VDA(t) = VDA × (1 − exp[−k × t]) for access of pool ATP and ADP to AK and AMPDA activities, respectively. Allowed ATPase VPmax values were ≤20 mmol/Lch, and allowed KPATP values were between 0.2 and 0.4 mM. The simulations sought values of VPmax, KPATP, and k that would provide a good fit to the measured Ca2+-induced ATP decline as reported in Fig. 4 (reproduced as closed circles here). The values of VPmax, KPATP, and k offering the fit shown by the red curves were 20 mmol/Lch, 0.3 mM, and 0.17 min−1, respectively. (A) Comparison of model-estimated ATP decline rates with experimentally measured points (closed circles). The blue curves report the ATP and ADP concentration changes that would be generated within an isolated pool by an ATPase with the 20–0.3-VPmax–KPATP parameter values. The black curve reproduces the best fit to the ATP decline rendered by the original three-enzyme model, as shown in Fig. 5 B. (B) Overall nucleotide concentration change pattern predicted by the delay-extended three-enzyme model with the given ATPase parameters.

