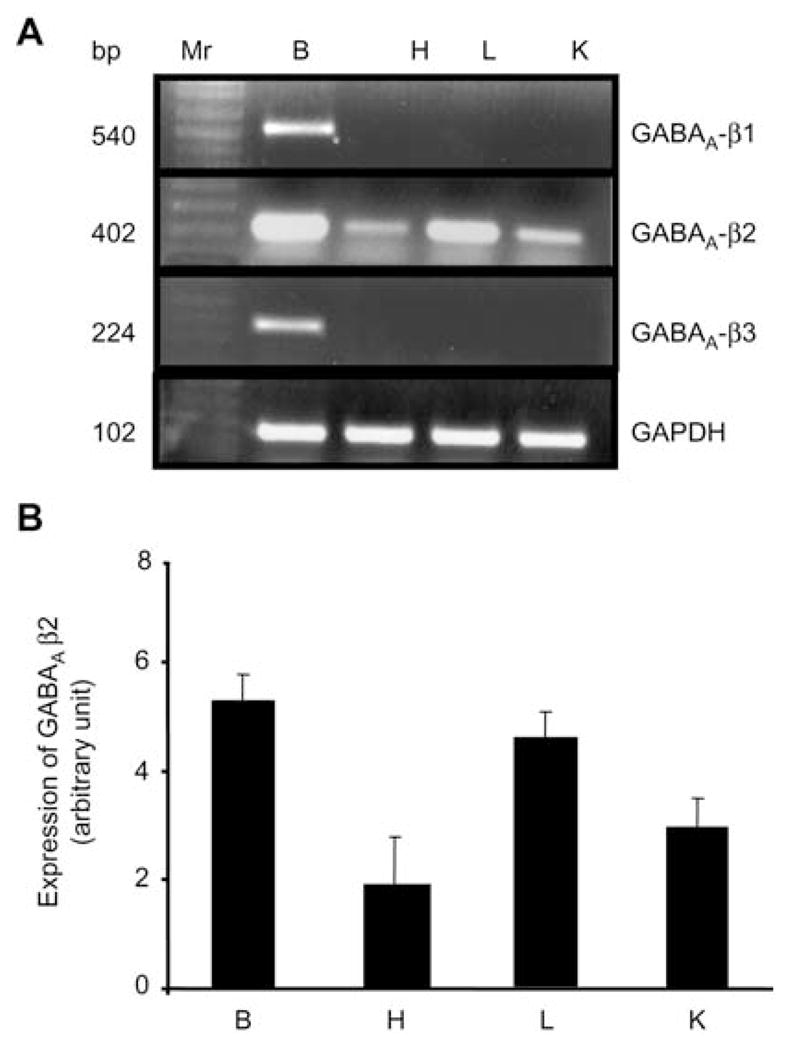
Figure 5.

The mRNA expression of GABAA-β subunits in brain (B), heart (H), lung (L) and whole kidney (K).
(A) Reverse transcription polymerase chain reaction (RT-PCR) analysis of GABAA-β subunits. Ethidium bromide-stained 1.0% agarose gels containing cDNA amplified from RT RNA using primers for GABAA-β1–3. A 100-bp DNA ladder (MW) was included at the left of the gel (Lane 1). cDNA bands of the predicted size were obtained for all the above subunits. n=4 animals from each group. (B) Corresponding densitometry analyses (bottom). Values are mean±SEM, n=4 animals from each group.
