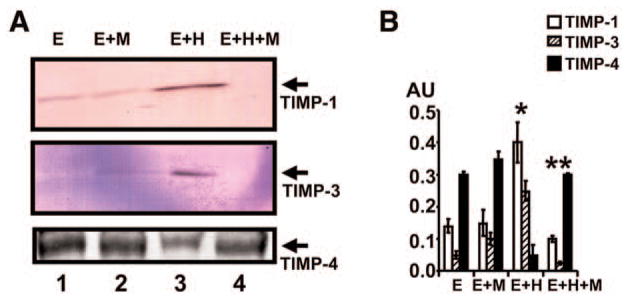
Fig. 3.
(A) Zymographic analysis of MMP-2 activity in the presence and absence of muscimol: 106 MVEC were cultured alone (E); with 40 μM muscimol (M); with 20 μM Hcy (H); and with Hcy and muscimol or anti-GABA-A antibody (AGA) or baclofen (B). After 24 h cell media were analyzed for MMP-2 activity. Western blot analysis of GABA-A receptor in MVEC. Cells were homogenized. Homogenates were loaded onto reducing SDS-PAGE and blotted using GABA-A receptor antibody. Corresponding actin bands are shown. (B) The bands in zymographic gels and Western blots were scanned and normalized with actin. *p < 0.01 compared with E alone. **p < 0.01 compared with E+H.

