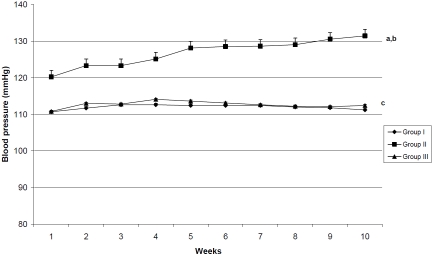
Figure 1.
Systolic blood pressure (SBP) mmHg in all studied groups through the weeks of the study. The mean SBP values of group II were significantly higher than those of group I & II. No significant differences were detected between the mean of SBP values of group I & III. a: p<0.001 as compared to group I. b: p<0.001 as compared to group II. c: non significant as compared to group I.

