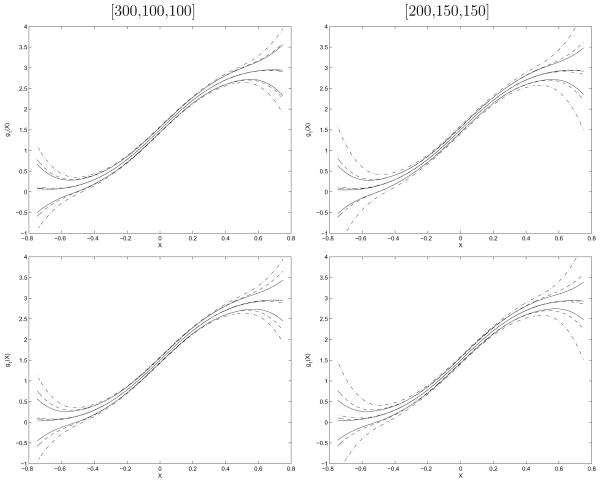
Figure 1.
Simulation results in Study 1. Confidence band comparison with sample size allocation of [300, 100, 100] and [200, 150, 150]. The plots from the first and second lines correspond to cut point a = 0.7 and 1.3 respectively. In each plot, the dotted curve in the middle is the true function. The solid, dashed and dot-dashed curves in the middle are the average P-spline fits over 1000 simulation respectively by the proposed method (P), the method based on a SRS sample with the same sample size as the ODS sample (S) and the method based on the SRS samples from the ODS design (V). For the confidence bands, the solid, dashed and dot-dashed curves are the confidence bands obtained by the P, S and V methods respectively.

