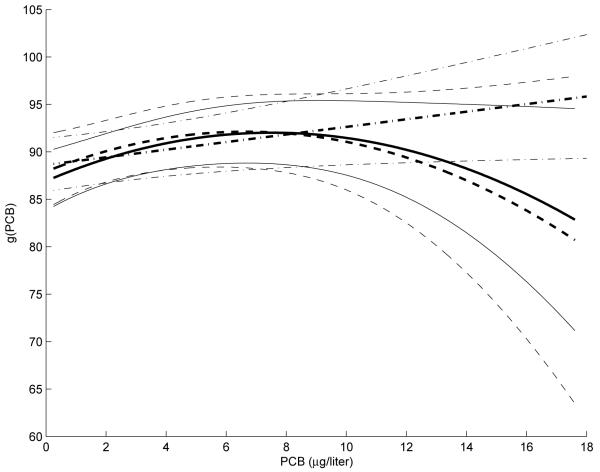
Figure 2.
Analysis results of CPP data. The estimated function g on PCB. Thicker solid and dashed curves correspond to estimates obtained by the P and V methods, and the thicker dot-dashed line corresponds to the linear fit using Zhou et al. (2002) method. And the solid, dashed curves and dot-dashed lines correspond to estimated confidence bands obtained by the corresponding methods respectively.

