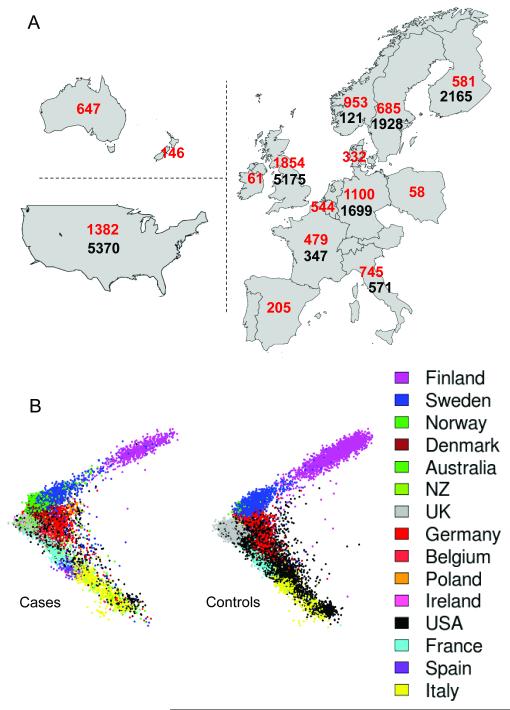
Figure 1.
Distribution of cases and controls. All cases and controls were drawn from populations with European ancestry; cases from 15 countries and controls from 8. A: numbers of case (red) and control (black) samples from each country. B: The projection of samples onto the first two principal components of genetic variation, with cases shown on the left and controls on the right. The axes are orientated to approximate to the geography, and samples are colour coded as indicated in the legend. We genotyped the cases (9772) and some Swedish controls (527) using the Illumina Human 660-Quad platform, and the UK controls (5175, the WTCCC2 common control set12,13) using the Illumina 1.2M platform. All other controls were genotyped externally using various Illumina genotyping systems (see Supplementary Information).

