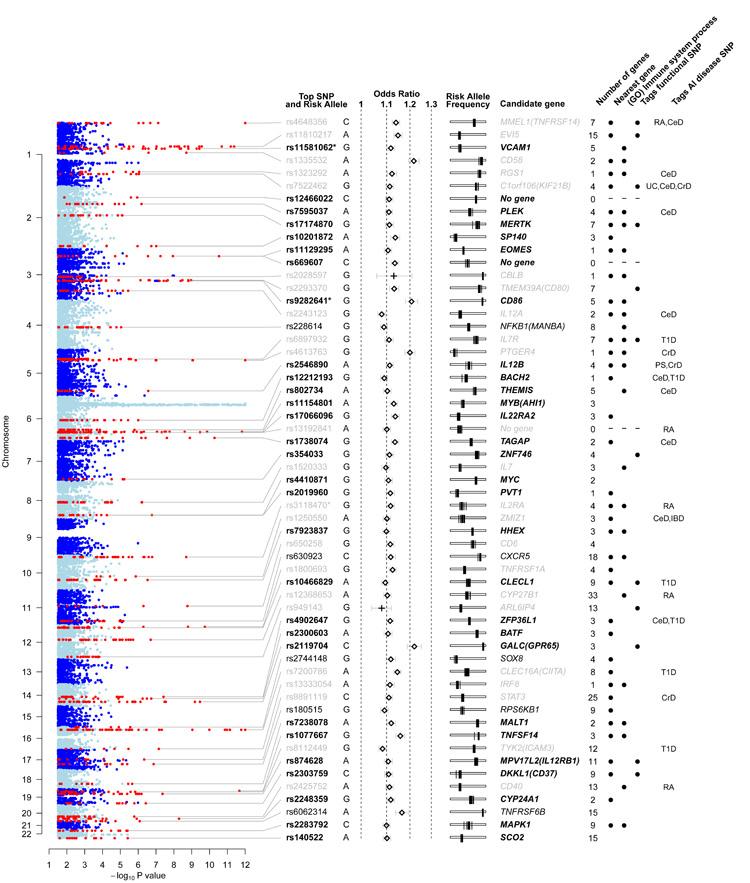
Figure 2.
Regions of the genome showing association to multiple sclerosis. Columns from left to right: evidence for association from the linear mixed model analysis of the discovery data (thresholded at −log10(p) = 12). Non-MHC regions containing associated SNPs are shown in red and are labelled with the rsID (bold for newly identified loci, black for strong evidence, grey for previously reported) and risk allele of the most significant SNP. * indicates that the locus contains a secondary SNP signal. Odds ratio and 95% confidence intervals estimated from the meta-analysis of the discovery and replication data (+ indicates estimates for previously-known loci from discovery data only). Risk allele frequency estimates in each of the control populations used in the study (each is shown as a vertical bar on a scale from 0 to 1 going left to right). For each region of association the number of genes is reported, and where non-zero a candidate gene is given. Black dots indicate that the candidate gene is physically the nearest gene included in the “immune system process” GO term. When the most-significant SNP tags a SNP predicted to have an impact on the function of the candidate gene this is indicated. Where such a SNP exists, the gene involved is selected as the candidate gene; otherwise the nearest gene is selected unless there are strong biological reasons for a different choice. The final column indicates SNPs which are correlated (r2 > 0.1) with SNPs reported to be associated with other autoimmune (AI) diseases (abbreviations: RA = Rheumatoid arthritis; CeD = Celiac disease; UC = Ulcerative colitis; CrD = Crohns’s disease; T1D = Type 1 diabetes; PS = Psoriasis). An interactive version of the figure is available at www.well.ox.ac.uk/wtccc2/ms.

