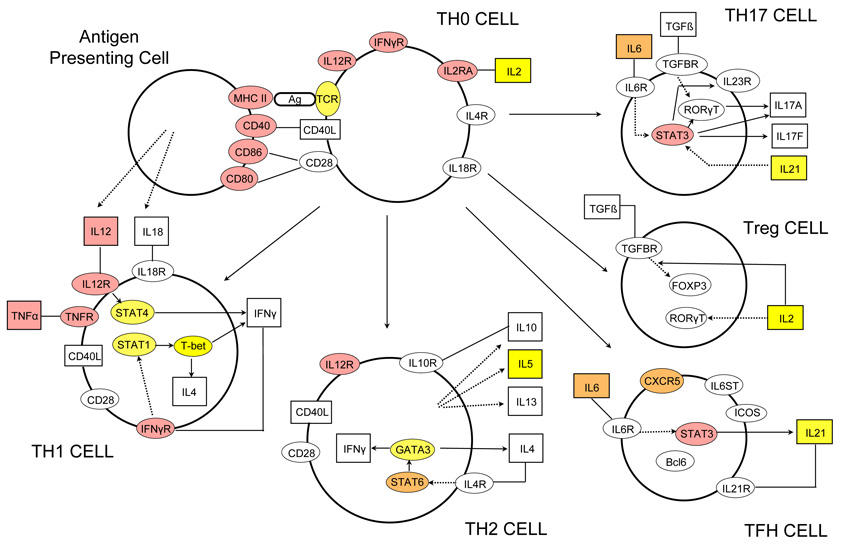
Figure 3.
Graphical representation of the T helper cell differentiation pathway. The figure is derived from an image generated by Ingenuity Pathway Analysis (IPA) software version 8.8 (Ingenuity Systems, Inc., Redwood City, CA, USA). Alpha-numeric labels indicate the individual genes and gene complexes (nodes) included in the pathway (note some are included more than once). Coloured nodes are those containing a gene implicated by proximity to a SNP showing evidence of association. Red: in bold or grey in Figure 2 (plus MHC class II region and TNFα); Orange: other loci in Figure 2 or discovery P value < 1×10−4.5 and consistent replication data. Yellow: Discovery P value < 1×10⁻³. Other molecules (proteins, vitamins etc.) may also be of relevance in these processes but are not included here as they are not currently listed as being part of this particular pathway in the IPA database.

