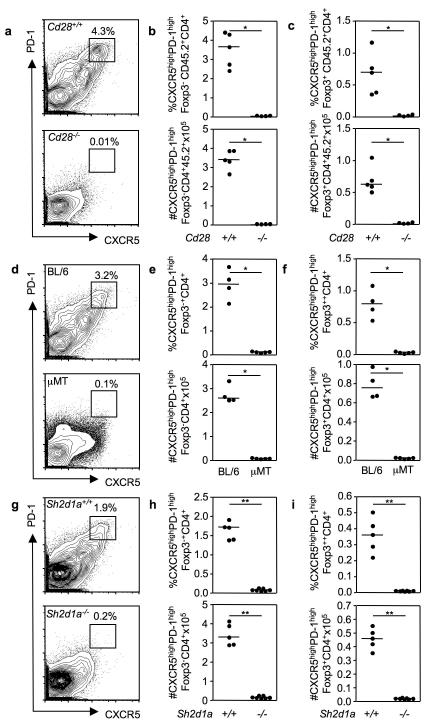
Figure 2. TFR require the same differentiation cues as TFH cells for their development.
Flow cytometric contour plots (a, d, g) and dot plots of TFH (b, e, h) and TFR (c, f, i) cells in the groups of mice described below, seven days after SRBC immunization. (a-c) Mixed bone marrow chimeras generated by sub-lethally irradiating Rag2−/− mice and reconstituting their immune system with a 1:1 ratio of bone marrow cells from CD45.1 Cd28+/+ and CD45.2 Cd28−/− mice or control CD45.1 Cd28+/+ and CD45.2 Cd28+/+. (d-f) C57BL/6 (BL/6) and B-cell deficient μMT mice. (g-i) Sh2d1a+/+ and Sh2d1a−/− mice. Each symbol represents one mouse and horizontal bars represent median values. Figures represent one of 3 independent experiments with similar results. Statistical significance was determined using a Mann-Whitney Test: *P<0.05, **P<0.01.

