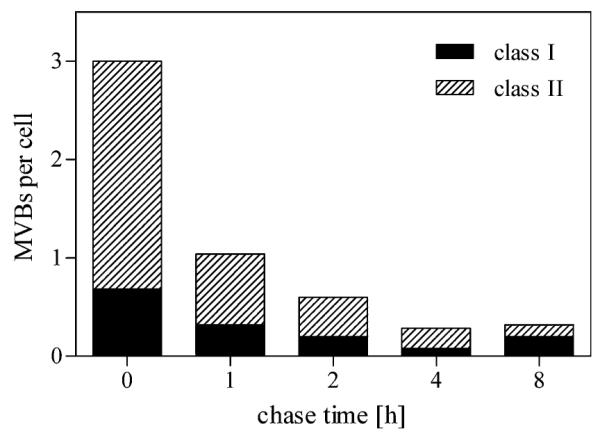
Fig. 10.

Semi-quantitative analysis of MVBs during pulse chase. Pulse chase experiments were performed as described in Fig. 9 and HDL-positive MVBs were analyzed semi-quantitatively as described. The numbers of “class II” as well as “class I” MVBs decrease substantially after a 1-h chase period. After 4 h, HDL-positive MVBs are hardly detectable
