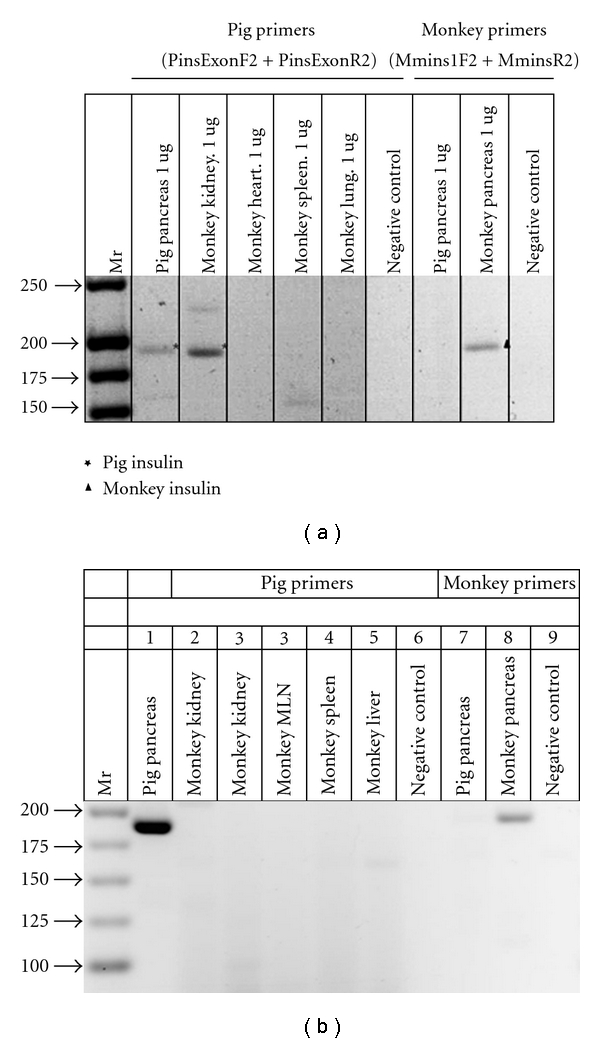
Figure 3.

RT-PCR: (a) shown left to right are DNA molecular weights (Mr); amplification of bands using primers specific for porcine proinsulin from 1 ug RNA extracted from pig pancreas or from a rhesus macaque (monkey) transplanted with E28 pig pancreatic primordia in mesentery followed by implantation of porcine islets in the renal subcapsular space: kidney, heart, spleen, lung, a negative control for porcine-specific primers (no RNA); amplification of bands using primers specific for monkey proinsulin from 1 ug of pig pancreas RNA; monkey pancreas; a second negative control for macaque-specific primers. (b) Shown left to right are DNA molecular weights (Mr); amplification of bands using primers specific for porcine proinsulin from 2 ug RNA extracted from pig pancreas or from a rhesus macaque (monkey) implanted with porcine islets in the renal subcapsular space with no previous transplantation of E28 pig pancreatic primordia: kidneys, mesenteric lymph node (MLN) spleen, liver, a negative control for porcine-specific primers (no RNA); amplification of bands using primers specific for monkey proinsulin from 2 ug of pig pancreas RNA; monkey pancreas and a second negative control for macaque-specific primers. Pig primers amplify a 193 bps band. Monkey primers amplify a 199 bps band. Reproduced with permission from Organogenesis [8].
