Figure 1.

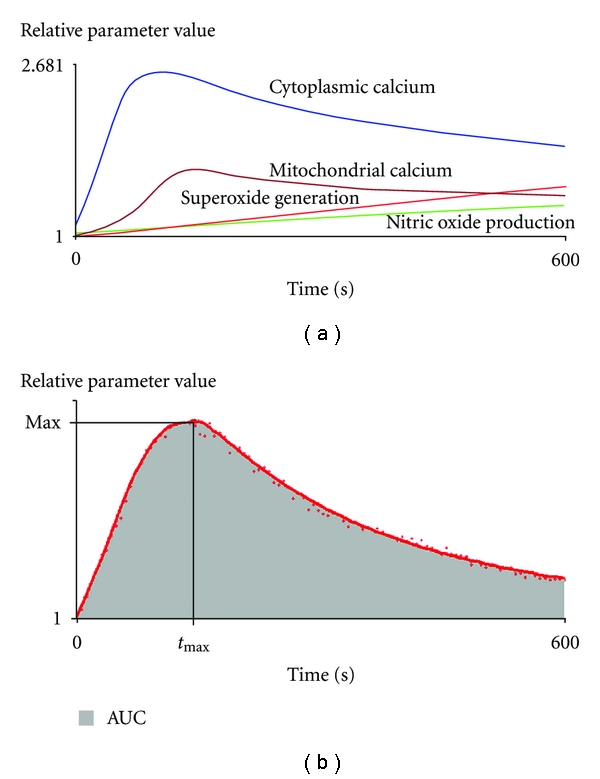
Schematic demonstration of characteristics changes of intracellular processes following PHA activation of lymphocytes. AUC: area under the curve, Max: maximum value, t max : time to reach maximum.

Schematic demonstration of characteristics changes of intracellular processes following PHA activation of lymphocytes. AUC: area under the curve, Max: maximum value, t max : time to reach maximum.