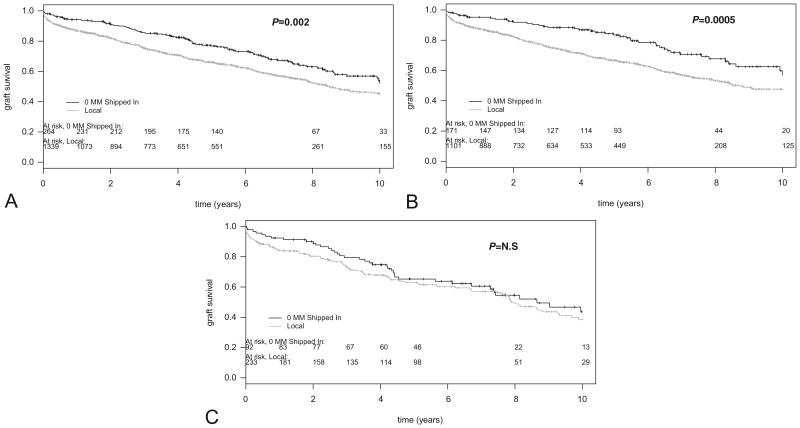
Figure 1.
Graft survival of 0-mismatched (0MM) shipped versus a local more than 0MM kidneys at the University of Wisconsin, Madison, from 1993 to 2006. (A) All patients. Patients received a 0MM shipped (n=264; black line) or a local >0MM (n= 1339; gray line) kidney transplant from a deceased donor. Individual graft survival time points are indicated by vertical marks on survival curves. Log-rank P=0.002; number of patients at risk for rejection over time are indicated on this and subsequent figures. (B) Nonsensitized patients only. Patients with less than 20% panel reactive antibodies (PRA) at the time of transplant received a 0MM shipped (n=171; black line) or a local >0MM (n= 1101; gray line) kidney transplant from a deceased donor. Log-rank P value=0.0005. (C) Sensitized patients only. Patients (≥20% PRA) received a 0MM shipped (n=92; black line) or a local more than 0MM (n= 233; gray line) kidney transplant from a deceased donor. Log-rank P=0.583 (not significant).

