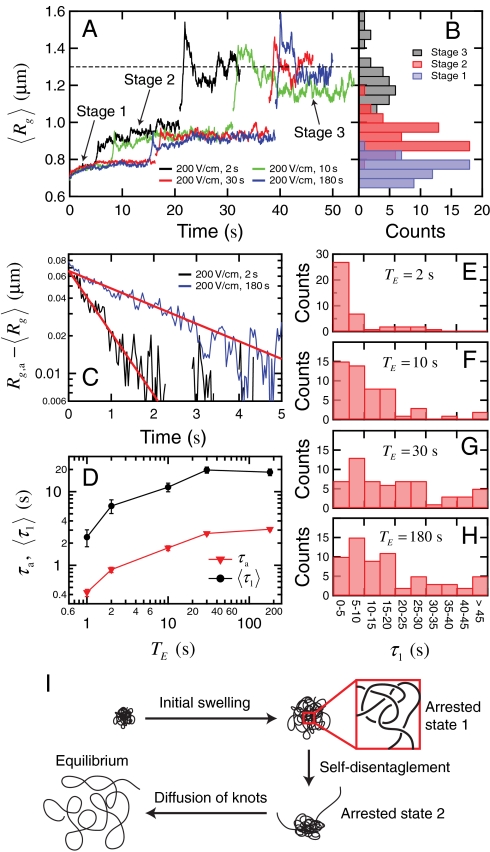
Fig. 4.
(A) Ensemble average radius of gyration vs. time in the three stages of type II expansion for four DNA ensembles all compressed under Erms = 200 V/cm but for different durations. The  traces for the three stages are simply plotted in a consecutive manner for clear illustration. The black dashed line indicates the equilibrium average radius of gyration. (B) Distributions of the time average radii of gyration of individual DNA molecules in each stage of expansion. (C) The quantity
  as well as the corresponding fitted single exponential function (B exp(-t/τa), red lines) with time in stage 1 of the expansion for the DNA ensembles compressed for 2 s and 180 s. (D) The fitted time constant τa of the initial swelling process and the ensemble average duration
  of the first stage as functions of TE. If not visible, the error bar (standard error) is smaller than the symbol size. (E)–(H) Distributions of the duration τ1 of stage 1 for the four DNA ensembles. (I) Schematic of the expansion pathway of an entangled globule.

