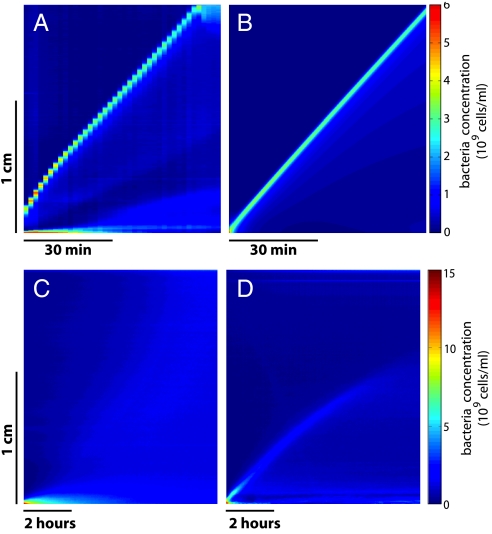
Fig. 2.
Kymographs in several experimental and theoretical conditions. (A) Experimental kymograph corresponding to Fig. 1. The velocity of 4.1 μm/s is reached after 20 min. The staircase shape is due to a too large time lapse between successive images. (B) Simulated kymograph obtained with the conditions listed in the text (see Table 1) [same scales as box (A)]. (C) Experiment performed with the nonchemotactic RP2867 strain. No wave generation is observed. (D) Experiment performed with the chemotactic strain in Motility Buffer. The very slow initial wave is attributed to the remaining nutrients present in solution after resuspension. However, this wave decays rapidly and vanishes completely at mid length of the channel. Note the different scales for (C) and (D) compared to (A) and (B).

