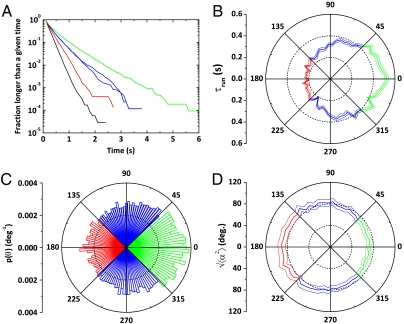
Fig. 3.
Microscopic descriptions of the bacteria trajectories: (A) Cumulative distributions of run and tumble durations. (Mean run or tumble times result from a fit of these distributions by an exponential). Due to chemotaxis, runs in the direction of migration (green) are longer than runs in perpendicular directions (blue), themselves longer than runs in the opposite direction (red). The black curve is representative of the tumbles. (B) Dependence of mean run time with direction. (C) The angular distribution of the runs is biased in the direction of migration meaning that the reorientation is nonisotropic. (D) SD of the reorientation angle ( ) as a function of the direction of the preceding run. Runs in the same direction as the global motion reorient less than the ones directed backwards. In all these polar plots, the angle is θ as defined in Fig. 1A in the x-y plane (θ = 0 corresponds to the direction of migration). On boxes B and D, the thin lines are the error bars SEMs.

