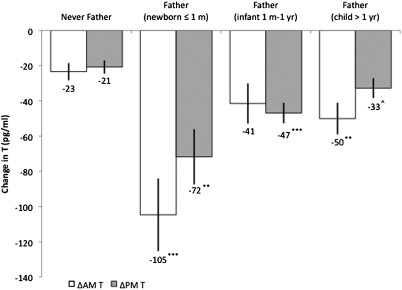
Fig. 2.
Between-group changes in AM and PM T values between 2005 and 2009 with fathers stratified by child age. Values are adjusted for time of saliva collection and usual wake time (AM) and are derived from regressing the change in T on fatherhood, stratified by child age, with men who were not fathers in 2005 and 2009 as the comparison group, and controlling for sleep quality and psychosocial stress (Tables S5 and S6). Fathers of newborns were men whose youngest child was in the perinatal period [1 mo (m) old or less]. Fathers of infants were men whose youngest child was older than 1 mo (m) but 1 y (yr) old or less. ^P < 0.10; **P < 0.01; ***P < 0.001. Error bars indicate SEM.

