Fig. 3.
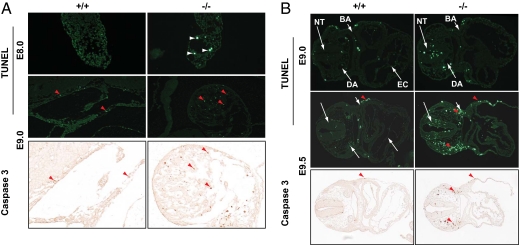
FoxO1-deficient embryos manifest progressive apoptotic cell death. The DeadEnd fluorometric TUNEL system and immunohistochemical analyses for activated caspase-3 were used to compare programmed cell death in FoxO1-WT (+/+) and -null (−/−) allantois (A) and embryo proper (B). Note an increase of apoptotic cell death in allantois (white arrowheads) and embryos of FoxO1-null mice. Red arrowheads indicate TUNEL- and corresponding caspase-3–positive cells. All images were captured using a 10× objective, except that the allantois with caspase-3 staining was at 20× magnification. BA, branchial arch; DA, PHV, EC, and NT are as in Fig. 1 and indicated with white arrows.

