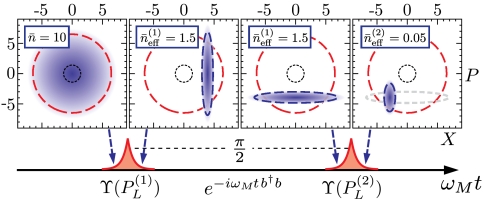
Fig. 3.
Wigner functions of the mechanical state (above) at different times (indicated by arrows) during the experimental protocol (below). From left: Starting with an initial thermal state  , (this is chosen to ensure the figure dimensions are reasonable,) a pulsed measurement is made with χ = 1.5 and outcome
  obtained, which yields an XM quadrature squeezed state. The mechanical state evolves into a PM quadrature squeezed state following free harmonic evolution of 1/4 of a mechanical period prior to a second pulse with outcome
  yielding the high-purity mechanical squeezed state. The effective thermal occupation of the mechanical states during the protocol is indicated. The final state’s occupation can be reduced below unity even for large initial occupation, see Eq. 7 of the main text. Dashed lines indicate the 2σ-widths and the dotted lines show the ground state (
 ) for comparative purposes. The displacement Ω is not shown.

