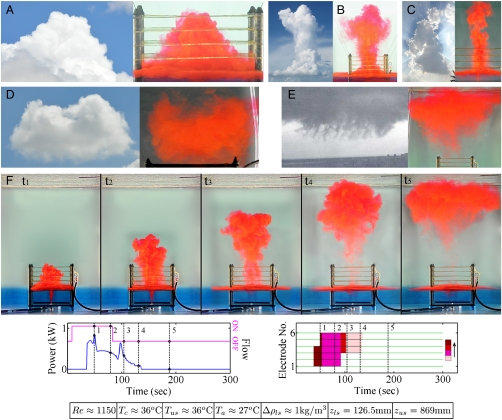
Fig. 3.
(A–F) (Rows 1 and 2) Comparison of clouds (Left) with simulations (Right). [In some pictures backgrounds of the images, especially (E) and (F), have been digitally denoised]. (Row 3) Sequence of snapshots in cumulus-cloud evolution following a Namias scenario (34). (Lower) (Left) Heating and flow history, (Right) heating profile during cumulus evolution; color code at extreme right shows increased rate of heating in the direction of the arrow. Reynolds number is defined as Re = Ud/ν, where U is orifice-exit velocity, d is orifice diameter and ν is kinematic viscosity. For other symbols see Fig. 2 caption. Note that the temperatures are averaged over the duration of the experiment. Classification: (A), (B), (C), (F): t1–t4)—cumulus congestus; (D)—cumulus mediocris (in dissipating stage); (E)—cumulus fractus (popularly known as “scud”); (F): t5)—altocumulus cumulogenitus. The natural cloud in (E) is from ref. 36 and in (B) image from NOAA Research, courtesy of Jim W. Lee, National Weather Service.

