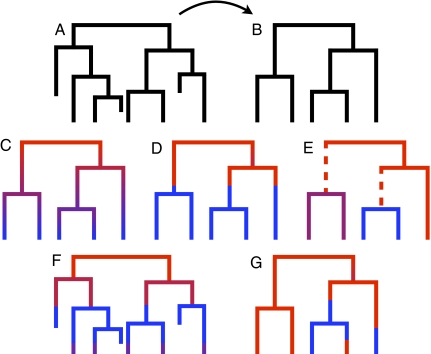
Fig. 1.
(A and B) Complete phylogeny (A) with associated reconstructed phylogeny (B), which is obtained by suppressing all extinct lineages. (C–G) Models for speciation and extinction. Red denotes a fast rate, purple an intermediate rate, and blue a slow rate of speciation. C–E indicate the three models accounting for rate heterogeneity through time and across subclades: (C) Morlon et al. (3) (continuous change over time), (D) Stadler (8) (change at one time point), and (E) Alfaro et al. (6) (change in the dashed edges above subclades). (F) Density-dependent model (the complete phylogeny instead of the reconstructed phylogeny is plotted as the speciation rate depends on the total number of lineages). (G) Trait-dependent model by Maddison et al. (14) (changes between the two rates at arbitrary times).

