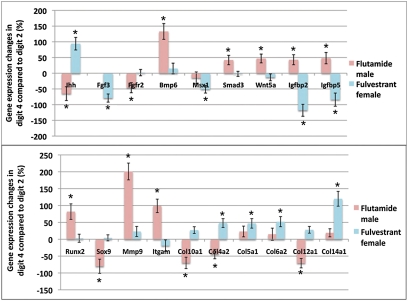
Fig. 5.
AR and ER have digit-specific effects on expression of skeletogenic genes. Results of quantitative RT-PCR expression analysis of 90 skeletogenic genes in 2D and 4D are shown. Graphs show relative transcript levels in primordia of 4D compared with 2D, which was assigned a value of 0. The 19 genes showing statistically significant differences (P < 0.05) of >40% are shown. See Table S1 for results of all 90 genes. Error bars show ± SEM, and asterisks denote significant differences.

