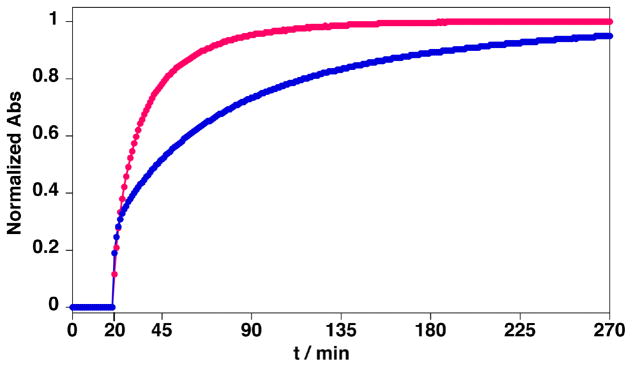
Figure 1.
UV monitoring of the chemical ligations. (
 ): between 1 (21 μM) self-assembled to QDs (0.9 μM) and 2 (14 μM) in presence of ~100 mM of aniline. (
 ): between 1 (22 μM) and 2 (14.9 μM) in presence of 100 mM of aniline and absence of QDs. Aniline was added to reaction mixtures at 20 min. Note that the contributions from the QDs and TAMRA to the absorption has been subtracted before normalization.

