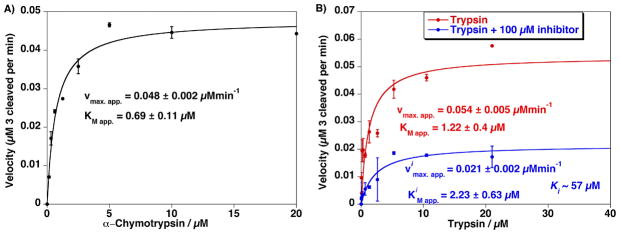
Figure 4.
A) Proteolytic activity from assaying an increasing concentration of Chymotrypsin versus a constant amount of QD–TAMRA substrate peptide 3 (0.1 μM QD). Estimated Vmax.app. and KMapp. are indicated. B) Proteolytic activity from assaying an increasing concentration of trypsin versus a constant amount of 537 nm QD–TAMRA substrate peptide 3 (0.1 μM QD) in the absence and presence of 100 μM ovomucoid trypsin inhibitor. Note the change in Vimax.app. while the KiMapp. values remain relatively unchanged which is consistent with a competitive inhibition process. Ki value of ~57 μM was estimated from the assay data in the presence of inhibitor. Error bars represent standard deviation from the mean of triplicate measurements.

