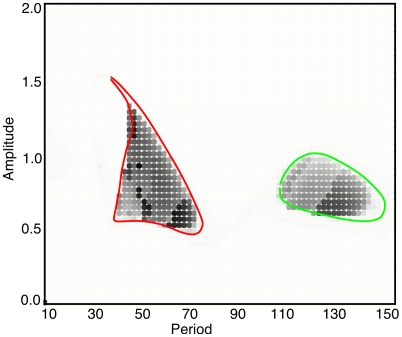
Figure 3. “Phase-diagram” for the one-dimensional spatial model.
Each point represents a simulation at a fixed value of the amplitude and period for the flashing stimulus. The gray-scale represents the magnitude of the pattern averaged over time. Specifically, the time average of  is plotted. If there is a spatially homogeneous pattern,
  . The curves super-imposed on the diagram represent regions where the homogeneous state is shown to be unstable.

