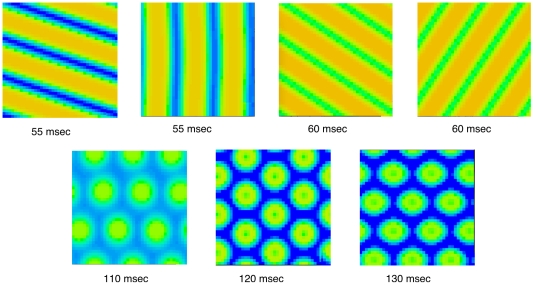
Figure 4. Sample two-dimensional patterns seen in a  grid with periodic boundary conditions.
Top row shows patterns seen with high frequency stimuli. Pairs show the results of different random initial conditions. Bottom row shows patterns seen at lower frequency; each pattern has the same period as the stimulus.

