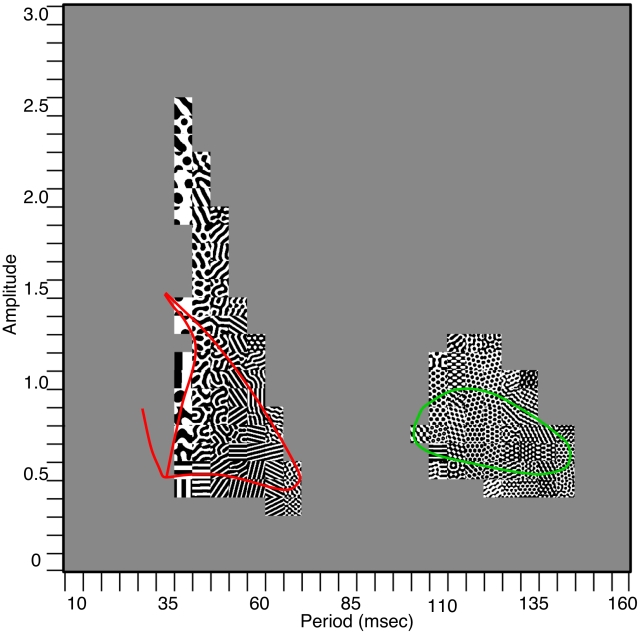
Figure 6. Two-parameter phase diagram for the model.
Each square is a simulation of a  domain with periodic boundary conditions. Patterns are shown as the period and amplitude range over the relevant intervals. Colored curves represent the theoretical boundaries for instability of the spatially uniform state.

