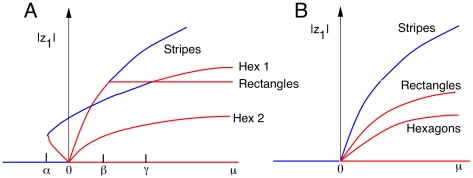
Figure 10. Schematic bifurcation diagram for patterns on a hexagonal lattice.
(A) Bifurcation at low frequencies in equation (8) for the case where  and
and  (after [32], figure 5.8).
  ,
,  and
and  Blue curves represent stable solutions and red curves represent unstable solutions. The bifurcation parameter
  is along the
  axis and the magnitude of the component of vertical stripe pattern (
 ) is along the
  -axis. (B) Diagram for high frequency patterns where
  by symmetry. Because
  , only stripes of various orientations are stable.

