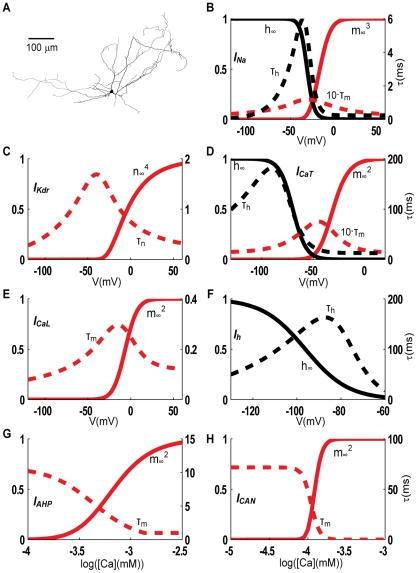
Figure 1. Morphology and ion channel kinetics.
The same dLGN morphology (A) was used in all simulations. The steady state values of activation/inactivation variables (red/black full lines), along with the activation/inactivation time constants (red/black dotted lines) are plotted as a function of voltage for voltage dependent ion channels (B–F), and as a function of intracellular calcium concentration for calcium dependent ion channels (G–H). Na and Kdr kinetics are shown for the parameterization P1 of the model. With respect to this, P2 kinetics was shifted +2.3 mV and +3.2 mV for Na and Kdr respectively. For all other ion channels, the same kinetics applies to both parameterizations (P1 and P2).

