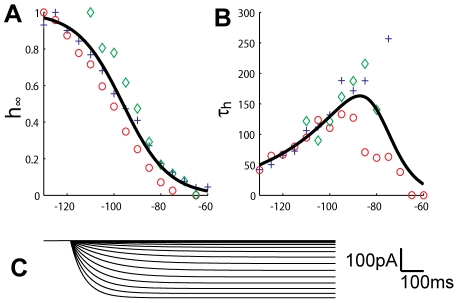
Figure 3. Ih-kinetics.
The steady state values of Ih-activation (A), and activation time constant (B), fitted to data from three INs (plusses, circles and diamonds). A simulation of the Ih-current at different step potentials between -130 and -65 mV, with 5mV steps (C) gives similar traces to those seen experimentally (see Figure 2C).

