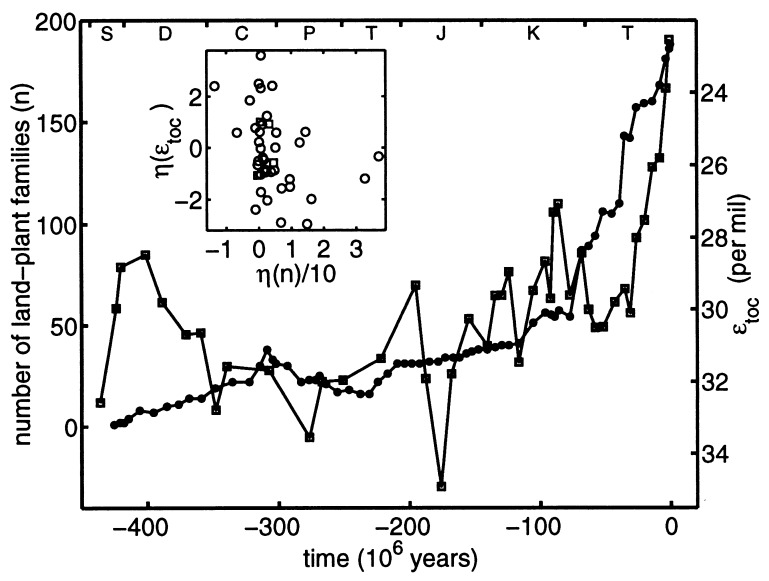
Figure 2.
The diversity n of terrestrial plant families (filled circles) (12) plotted with the same geochemical data (open squares) of Fig. 1, beginning with the rise of land plants in the Silurian (425 Ma). The vertical axis for ɛtoc again increases downward. The data track each other reasonably well after 370 Ma. The geologic time scale is the same as in Fig. 1. The diversity curve shown is the “minimal” curve of the plant family database; rough error bars may be inferred by comparison with the corresponding “maximal” curve. (Inset) The whitened sequence ηj(ɛtoc) vs. ηj(n) obtained by prediction-error filtering. Squares and circles represent data before and after 370 Ma, respectively.

