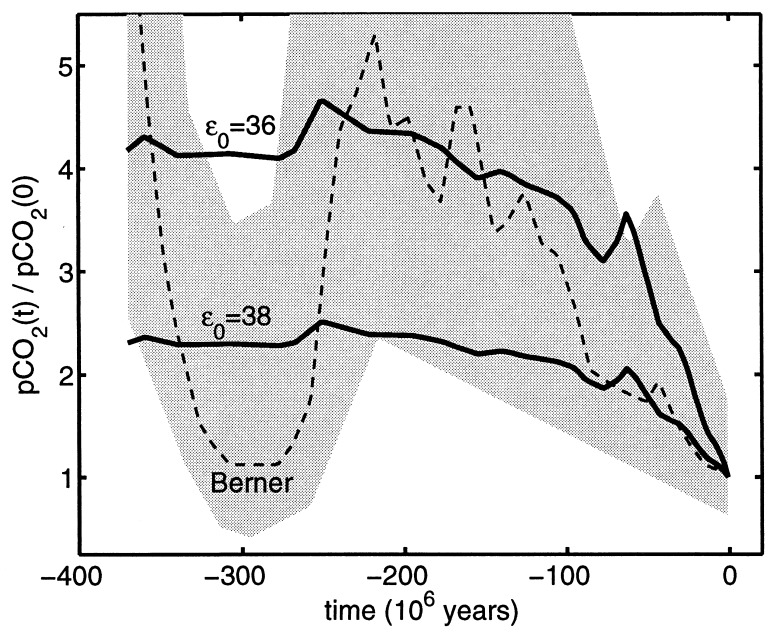
Figure 3.
Smooth curves: estimates of the normalized partial pressure of atmospheric CO2 [pCO2, which is proportional to [CO2] (40)] for the last 370 million years, obtained from the model Eq. 20 and the least-squares estimates of the parameters φ0 and b, for the cases ɛ0 = 36‰ and ɛ0 = 38‰. Because Eq. 20 is linear in n, these curves are simply the diversity curve of Fig. 1 upside down and rescaled. Dashed curve and gray area: prediction from the model of Berner (15, 16) and its region of qualitative uncertainty, respectively, from ref. 17.

