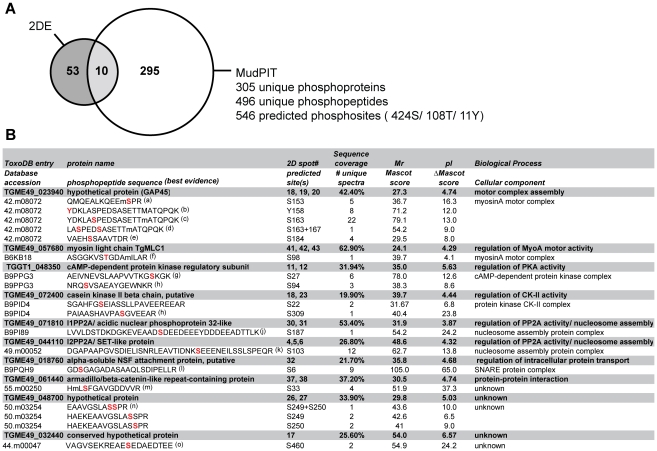
Figure 2. Functional annotation analysis of Toxoplasma phosphoproteins identified by MudPIT and comparison of proteomics strategies.
A) Venn diagram summarizing the number of confident tachyzoite phosphoprotein identifications (<1% FDR) detected by 2-DE- or MudPIT-based LC-MS/MS analyses. A comparison of 2-DE and MudPIT datasets enabled us to cross-validate 10 major Ca2+-dependent tachyzoite phosphoproteins represented by 21 32[P]-labelled 2-DE spots and 86 phosphopeptide spectra (see Supplementary Figure S2, Tables S1-S4 for details). B) Summary of LC-MS/MS evidence for Ca2+-dependent tachyzoite phosphoproteins and their associated phosphorylation sites. Listed in the columns (from left to right) are: Top rows (grey background): The ToxoDB entry (ToxoDB release 6.0), protein name, number of 2-DE spot(s) in which each protein was identified (cross-reference to Supplementary Table S1), amino acid sequence coverage, molecular weight (Mr), isoelectric point (pI) and, based on 2-DE gel LC-MS/MS identifications. Bottom row (white background): The database accession (ToxoDB release 4.0 or UniProt entries), predicted phosphorylation site(s), total number of unique spectra (rank 1), highest individual Mascot score (rank 1), delta Mascot score (rank 2), based on LC-MS/MS analyses of MudPIT data. The above information was used in conjunction with independent literature searches to assign keywords associated with Biological Processes or Cellular Components and identify homologs and conserved phosphorylation sites in P. falciparum, as indicated in the last column. (a-o) MS/MS evidence spectra shown in Supplementary Figure S2.

