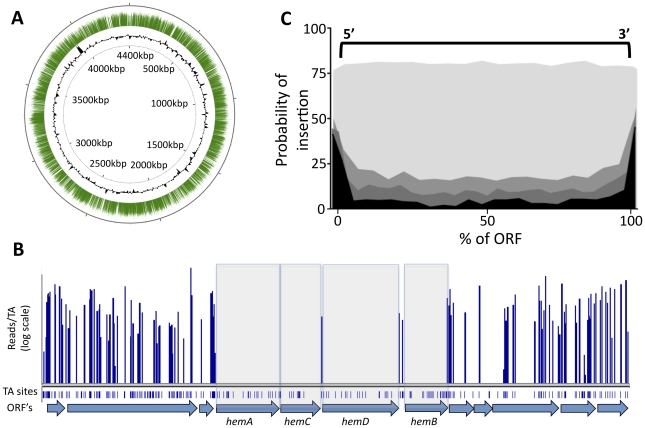
Figure 1. Transposon insertions are randomly distributed, and gaps in transposon coverage correspond to predicted essential ORFs.
(A) Transposon:chromosome junctions from high density mutant libraries were identified by deep sequencing. The number of sequence reads corresponding to each insertion site is represented as green bars mapped onto the circular chromosome of M. tuberculosis H37Rv. Black contour represents the GC content of the chromosome (G+C content greater or less than 50% are represented as contours outside or inside the ring, respectively). Nucleotide positions are indicated (kilobases). (B) Essential heme biosynthetic genes are devoid of insertions. The number of sequence reads (“reads/TA”) is shown for the indicated region of the H37Rv chromosome. Potential TA dinucleotide insertions sites are indicated. (C) Each potential TA insertion site in the genome was assigned a position relative to the nearest ORF. The probability of detecting an insertion at each ORF position (per 20 TA window) is plotted on the y-axis. Genes predicted to be nonessential (p value >0.5, shaded lightest gray) show no position-dependent insertional bias. In contrast, genes predicted to be required for growth with different degrees of confidence (p<0.2, p<0.01, p<0.00005, indicated in progressively darker shading) show a strong bias against insertions in the open reading frame.

