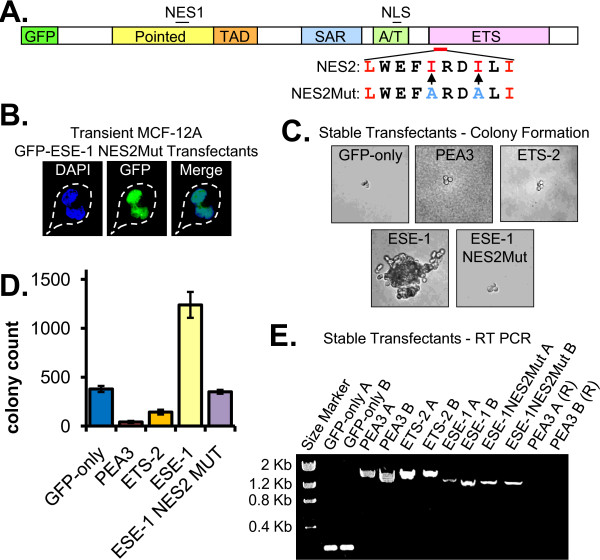
Figure 3.
Mutation of ESE-1 NES2 inhibits GFP-ESE-1-induced MCF-12A cell transformation. (A) Diagram of the GFP-ESE-1 protein showing the two isoleucine to alanine point mutations engineered in the ESE-1 NES2 sequence to generate the GFP-ESE-1 NES2Mut construct. Black lines above the diagram - NES1 or NLS. Red line below the diagram - NES2 (wild type NES2 sequence expanded below). Red letters - critical leucine and isoleucine residues in NES2. Blue letters - the isoleucine to alanine point mutations engineered to generate NES2Mut. (B) Direct fluorescence imaging of MCF-12A cells transiently expressing GFP-ESE-1 NES2Mut. DAPI panel - nuclear DAPI florescence (blue). GFP panel - GFP fluorescence (green). Merge panel - an overlay of the DAPI and GFP fluorescence. (C) Anchorage-independent growth of pooled MCF-12A cell populations expressing GFP-only, GFP-PEA3, GFP-ETS-2, GFP-ESE-1 or GFP-ESE-1 NES2Mut. Stable transfectants were plated in soft agarose and typical colonies were photographed eight days later (40X). (D) Quantitation of anchorage-independent colony formation. Two independent, stably transfected MCF-12A populations for each construct (GFP-only, GFP-PEA3, GFP-ETS-2, GFP-ESE-1 and GFP-ESE-1 NES2Mut) were seeded in triplicate soft agarose cultures and colonies visible by 6X bright field microscopy were counted 21 days later. Bars show average numbers of colonies per plate +/- s.e.m. (E) RT-PCR analysis of mRNA expression of GFP fusion constructs in stably transfected MCF-12A cells. For each construct two independently generated stable populations (A and B) were analyzed: GFP-only populations (GFP-only A and B), GFP-PEA3 populations (PEA3 A and B), GFP-ETS-2 (ETS-2 A and B), GFP-ESE-1 (ESE-1 A and B), GFP-ESE-1 NES2Mut (ESE-1NES2MutA and B). PEA3 A (R) and PEA3 B (R) - RNAse treated samples.

