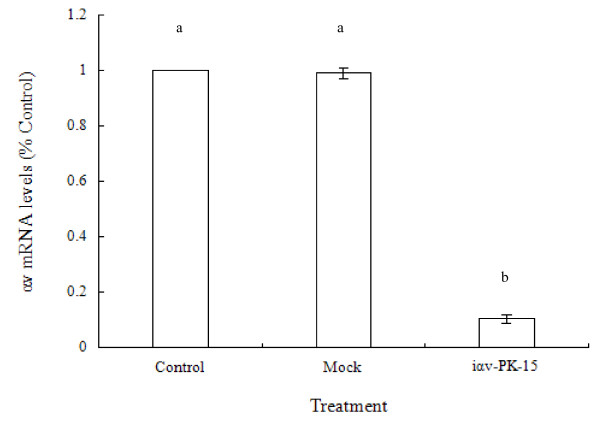
Figure 2.
Downregulation of αv mRNA of iαv-PK-15 detected with real-time qRT-PCR. Relative mRNA levels of αv gene are presented as the ratio of the αv mRNA quantity and the 1 ng β-actin (ng/1 ng β-actin) to facilitate comparison with the levels of inhibition of the αv gene. Data are shown as the average of three repeated experiments. Error bars show standard deviations. There was a highly significant difference between the control and mock, and iαv-PK-15 (P < 0.01).

