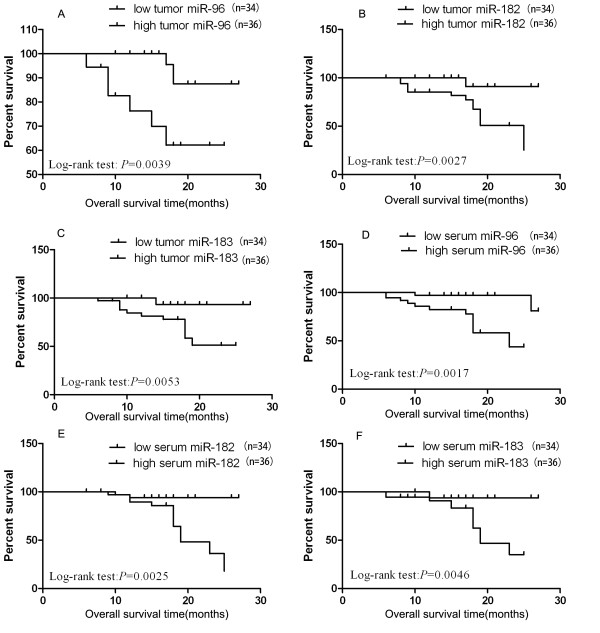
Figure 5.
Kaplan-Meier survival curves for NSCLC patients plotted for tumor and serum miR-96, miR-182, and miR-183. Kaplan-Meier survival curves for NSCLC patients based on the median level of fold change. The P-value was calculated using the log-rank test between patients with high- and low-fold changes. Overall survival of patients with high vs. low miR-183 family expression levels are shown. P < 0.05 indicates a significant difference between groups.

