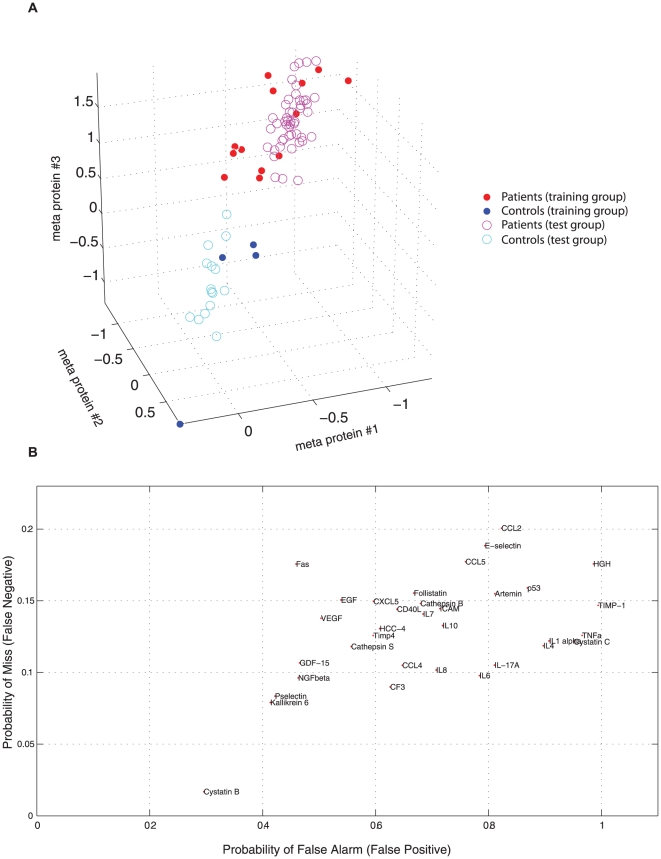
Figure 3. a) Supervised multivariate classification.
Typical results of a multivariate classifier design using 80% of the CVD samples. The cyan (control) and magenta (patient) open circles indicate the positions of the training examples in the compressed three-dimensional meta-protein space, created by the supervised procedure to classify the samples (see methods). The blue (controls) and red (patients) filled circles indicate the positions of the external test examples used to evaluate the particular classifier designed. These examples were assigned to the most common class among the three closest training examples (3-nearest neighbour classification). b) Supervised univariate analysis of individual proteins. Results obtained from the CVD samples by a supervised univariate analysis of the individual proteins with respect to their discriminatory power when they were used individually for 3-nearest neighbour classification. Each protein is displayed in terms of estimates of the probabilities of false alarm and miss that one would obtain if an optimal cut-off level for that particular protein was used alone to distinguish patients and controls.

