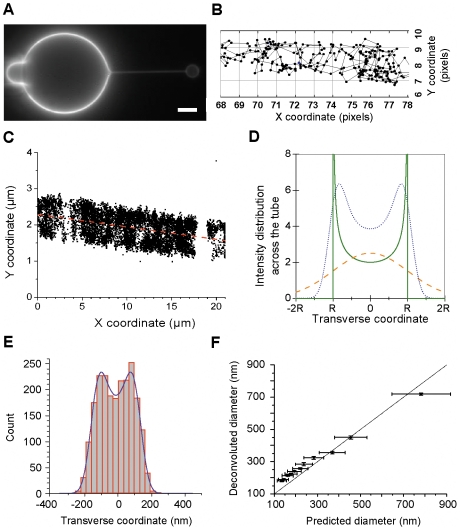
Figure 3. SPT allows simultaneous measurement of diffusion and tube diameters.
A) The model system where a thin tubular tether is pulled by an optically trapped, streptavidin-coated bead (right) from a giant unilamellar vesicle (GUV) tagged with biotinylated lipids. Changing the aspiration pressure in the micropipette (left) holding the GUV allows us to vary and control the diameter of the tether. Scale bar: 5 µm. B) An example of connected trajectory obtained on a membrane tube. Several tens of trajectories were constructed on every tube for the MSD analysis. One pixel is 160 nm. C) An example of the QD positions extracted from a series of 1000 images (before trajectory reconnection). The direction of the tube is determined by a linear fit of all detected positions (red dashed line). For the analysis of the transverse distribution of the QD positions, the coordinate plane is further rotated (not shown) to align the X axis with the direction of the tube. D) Mathematically predicted profile for the projection of points uniformly distributed over the surface of a tube on a plane (green solid line, cross-section is shown, Eq. 1). A Gaussian profile with the same area is shown for comparison (orange dashed line, Eq. 2) as well as the result of convolution (blue dotted line) of the predicted profile with a Gaussian according to Eq. 3. E) An example of the transverse distribution of the QD positions extracted from the series of images. The distribution is fit by the convolution (violet line) of the tube projection profile and a Gaussian (see panel D) to extract the tube diameter and the smearing parameter (see text). F) Comparison of the tube diameters obtained from the analysis of transverse distribution of the QD positions and the diameters calculated based on the membrane tension and the pulling force (mean ± SD).

