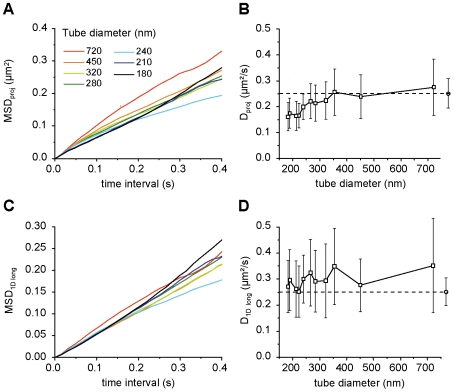
Figure 4. Analysis of diffusion on artificial tubes.
A,C) Averaged MSD plots of projected 2D-trajectories (A) and of the longitudinal components (C) of the displacements. The diameter of the tubes varied between the indicated values. B,D) D calculated from the corresponding MSD plots on the left. The reference value of the diffusion coefficient measured on the GUV surface (quasi-planar membrane) is shown with dashed horizontal lines and open circles (mean ± SD).

