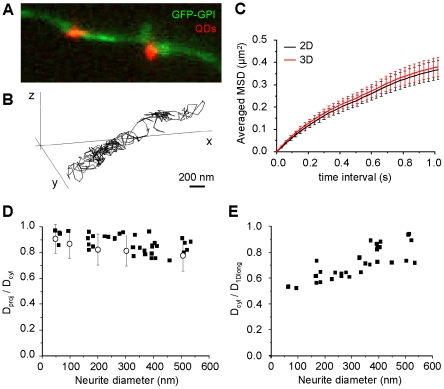
Figure 6. 3D single particle tracking of GFP-GPI.
A) Fluorescence image of a portion of neurite of a GFP-GPI transfected neuron (green) overlaid with two GFP-bound quantum dots (GFPGPI-QD, orange). The shape of the QD depends on its position in the Z axis. B) Example of a 3D GFPGPI-QD trajectory. Bar: 200 nm. C) averaged MSD plot for trajectories obtained by 3D SPT (3D, red) and their projections in the plane (2D, black) (mean ± sem) (n = 26 trajectories on different axons) D) Ratio of D on neurites (black squares) calculated without (Dproj) or with (Dcyl) the displacements in Z (n = 26 trajectories on different axons), and the equivalent ratio of D of simulated trajectories with diffusivities between 0.001 and 1 µm2/s (circles, mean ± s.e.m., n = 200) versus the diameter of the neurites or cylinders. E) Ratio Dcyl/Dproj versus the diameter calculated on the same neurites as D.

