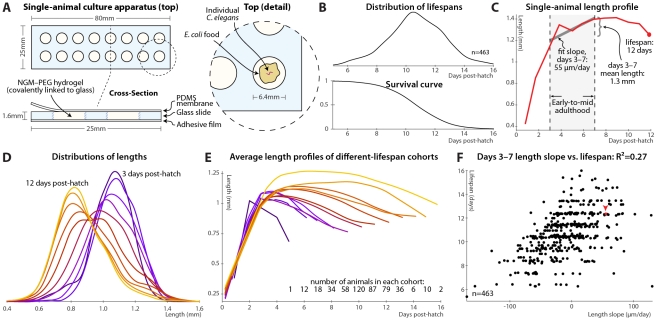
Figure 1. Single-animal vermiculture and measurement.
(A) Individual C. elegans and their bacterial food source live atop a gel pad, sealed with a gas-permeable polydimethylsiloxane (PDMS) membrane. (B) Variability in individual lifespans is clear from the distribution of lifespans of 463 animals reared in this apparatus, reconstructed via kernel density estimation. The corresponding survival curve is shown below the lifespan distribution, and represents precisely the same data. We prefer the distribution, as features such as bimodality and differences in variance are easier to identify. (C) Time-course of measured length for a single individual throughout its life. Early-to-mid-adulthood patterns in this (and other) measurements are summarized as the average level between days 3 and 7, and the slope of a least-squares fit line to the data in that range. (D) Kernel density estimates of the distribution of lengths of animals at different ages post-hatch, colored by age on a blue-red-yellow spectrum, demonstrate a general shrinkage with aging. (E) The average length over time is shown for cohorts of animals, grouped according to the number of days lived. Shorter-lived animals are in general smaller and shrink in size more quickly. (F) Size maintenance during adulthood (measured as the slope of the least-squares fit of age vs. length, days 3–7 post-hatch) correlates with eventual lifespan; R2 = 0.27 (p<10−33); the leave-one-out (l.o.o.) estimate of future predictive ability is also 0.27. The point corresponding to the individual in panel B is shown in red and marked with an arrowhead. Multivariate regression of lifespan against both length slope and days 3–7 mean length yields an R2 of 0.32 (p<10−38; l.o.o. 0.31).

